Marketplaces
Is the CS2 skin market really falling?
Pricempire’s “CS2 Market Cap” read 5,831,570,185.75 $ on October 14, 2026, down 14.1% over 30 days and 23.2% over 90 days. It is a third-party estimate, built from prices and estimated quantities, published on Pricempire’s Market Cap page: we looked at what moves that total.
The Veriloot team · Published on
592dbb131968… · Data: Pricempire, “CS2 Market Cap | Pricempire”In this article
Why this comes up now
On October 13, 2026, the X account TheGreenFireCS posted this message, with a screenshot of Pricempire’s chart:
WE ARE DOWN $86,000,000 IN THE LAST 24 HOURS ON THE CS MARKET CAP BRO
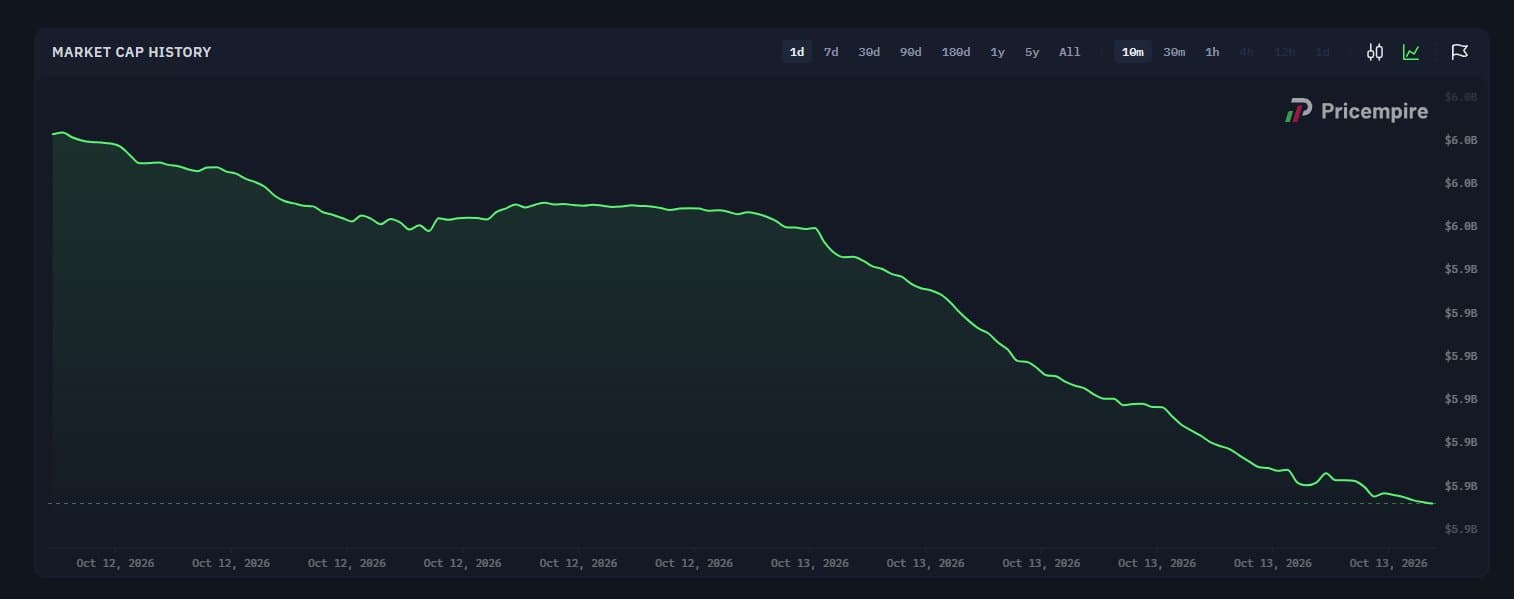
That is the account’s claim, not a figure we verified. Against the total Pricempire showed the next day, October 14, 2026, the amount is a small fraction of it. That same reading showed a 2.3% drop over 24 h, over a different window from the post’s.
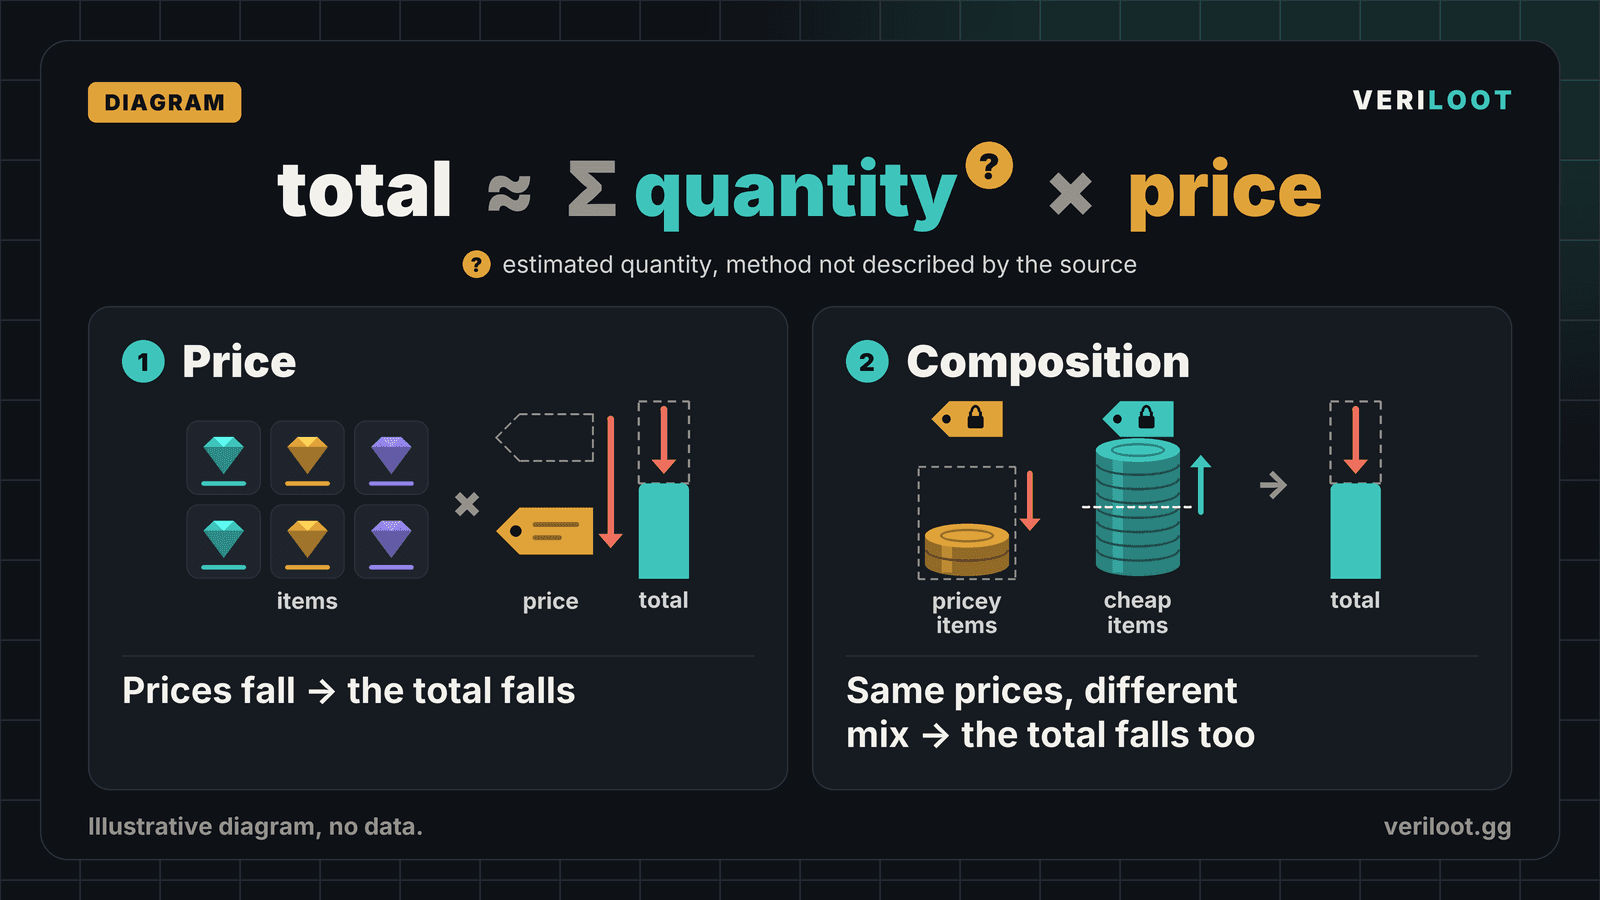
A total that size looks dramatic, but it blends the price of each skin and the number of copies attributed to it. Price and quantity do not move for the same reasons.
Where that total comes from
The principle is simple: for each item, a price multiplied by an estimated quantity (the "supply"), then the sum of all those values. Pricempire’s table, checked on October 14, 2026, runs to many pages of items. This is a principle to understand the number, not the site’s exact formula: from that table, we could not reproduce exactly either the total or the value of each row.
The quantity is an estimate. Valve does not publish how many copies of each skin exist. In the Pricempire pages we checked (table, guides, API page, tooltips), the method behind this quantity is not described.
The price is a listing, not a sale. We did not find the price rule in those pages either. On the items we compared with the listings recorded by Veriloot, a sample that does not represent the whole catalog, Pricempire seems to usually take the lower of the YouPin and BUFF163 listing prices: that is our best reading, not a confirmed rule. If that is the rule, a single cheap listing can be enough to set an item’s price.
When the total moves and prices don’t
In the history shown by Pricempire, the estimated number of copies changes in steps: on some days the item counter jumps, up or down, while the total value barely moves. One possible explanation: the items added or removed on those days carry little weight in the total. But a stable value can also hide price and mix changes that cancel out, and the history alone cannot settle it. This year the counter also steps down several times, which looks like corrections to the estimate; here too, we cannot tell how much of the change in the total on those days comes from prices and how much from the removed items.
This is a composition effect: a total can fall without any price moving, if cheap items take a larger share of the counted stock.
A fictional example to make it concrete: picture a stock split evenly between cheap items and expensive ones. If cheap items become a clear majority of the counted stock, with the same number of items and at the same prices, the total falls. No price moved, and neither did the item count: only the mix changed.
What the price changes say
In the history shown by Pricempire, the estimated number of copies has moved little in recent weeks. That is not enough to say the drop this chart shows in recent weeks comes from prices: the example above shows a total can shrink with a constant item count.
So we looked at the prices themselves. In Pricempire’s table of October 14, 2026, on the rows where prices and quantity are filled in for each period, and holding the quantities shown that day fixed, the value of that basket falls over 7 days, 30 days and 90 days. Taken together, the prices in that basket did fall over those periods. This test does not say how much of the drop in the historical chart comes from prices and how much from composition: past quantities for each item are missing.
Weighing heavily in a dollar drop is not the same as falling hard. An item counts more the pricier and more numerous it is; item by item, the table does not show that cheap skins are more stable, nor that the most expensive ones fall more. A "market" drop in dollars says little about how any given skin is doing.
Veriloot also tracks listing prices, marketplace by marketplace. To follow the trend with our own data, see our CS2 skin market statistics and the biggest CS2 skin price drops. How we record those prices is explained in our method.
The precedent of October 22, 2025
On October 22, 2025, Valve posted a CS2 update note letting players trade up Covert items for a knife or gloves, a knife only for StatTrak™ items. In the history shown by Pricempire, which peaks that same month, the next point shows a sharp fall in total value, with no notable rise in the item count.
That day the item counter barely moved: the average value per item is what fell. The total shown on October 14, 2026 is still well below that peak.
What this look can’t tell us
The real number of skins in circulation. Valve does not publish it, and none of the sources we examined gives it. Other sites also show an overall market cap; since their figures do not share the same date or scope, we don’t compare them here.
Actual sales. The prices used are listings. A listing price can drop without a single sale at that price.
What comes next. These numbers describe the past. They don’t say whether prices will recover or keep falling.
What it changes for you
A market total doesn’t tell you what your skin is worth. For a given item, look at the change in its own price, on one marketplace, over a dated period. A "market" drop can come from an estimated quantity that changed. This is not investment advice.
Sources
- Pricempire, “CS2 Market Cap | Pricempire”, undated
- Pricempire, “CS2 Market Cap | Pricempire (table)”, undated
- Valve, “Counter-Strike 2 Update”, Vitaliy, October 22, 2025
- X · X, “TheGreenFireCS (X)”, TheGreenFireCS, October 13, 2026